14. ImageAnalyzer
14.1. Introduction
The ImageAnalyzer1.py is a python script that allows you to extract distances and locations from a digital image. It can be used for example to analyze the interference pattern of the Fabry Perot interferometer to measure the line splitting observed in the normal Zeeman effect experiment. It can also be used to extract numerical values from a scanned image of a graph and in future experiments that are using a digital camera.
Quantitatively analyzing a digital image involves:
Calibrating the image to determine a conversion factor between pixel positions and the corresponding real world positions.
Extracting pixel locations and converting them into world positions and saving them in a data file.
Measuring the distance between 2 points on the image.
14.2. Using the Program
You can download IA3.zip and unzip it.
The script can be run in an IPython console (where you enter python commands) by doing:
%run ImageAnalyzer1
or by double clicking the IA.bat (Windows) or the IA.command (MacOS) file.
The program then opens a blank graph (Fig. 14.1):
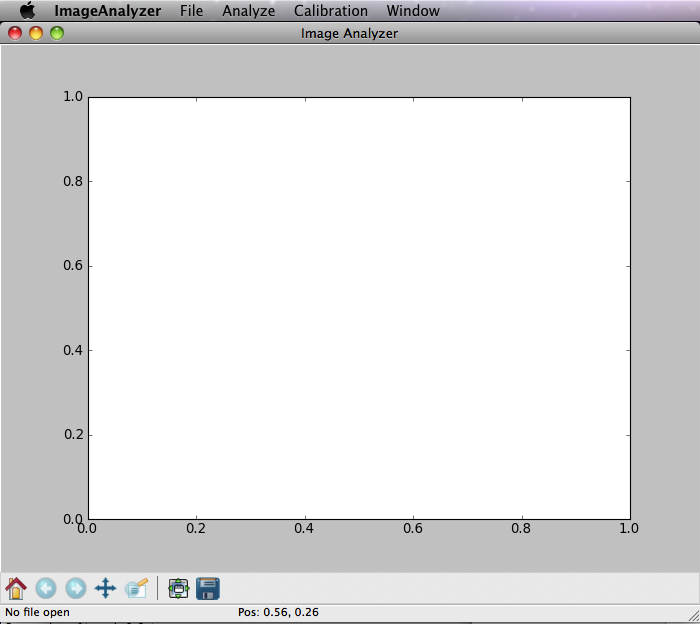
Fig. 14.1 Image analyzer opening screen.
14.2.1. Calibration
As a first step you should determine the calibration factors. For this, purpose you took an image of a ruler. Use the menu to open a file (Fig. 14.2):
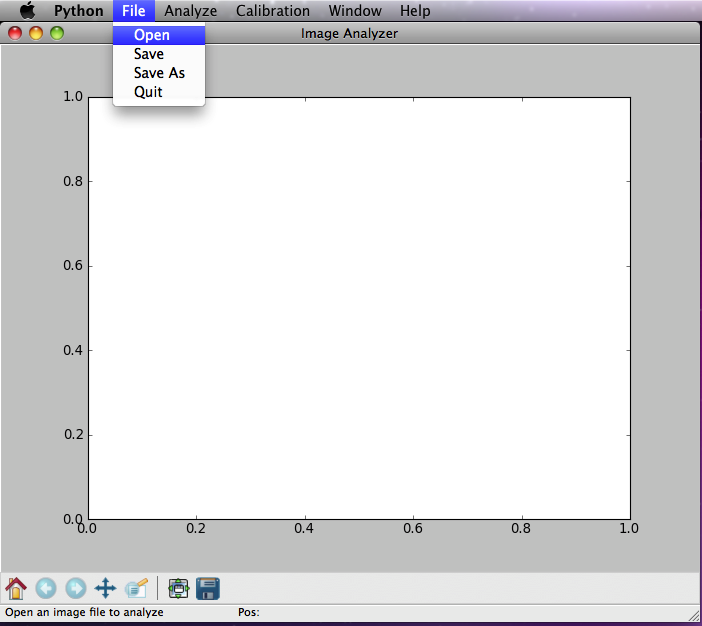
Fig. 14.2 Open a file.
Once the calibration image has been loaded you can start with the calibration (Fig. 14.3):
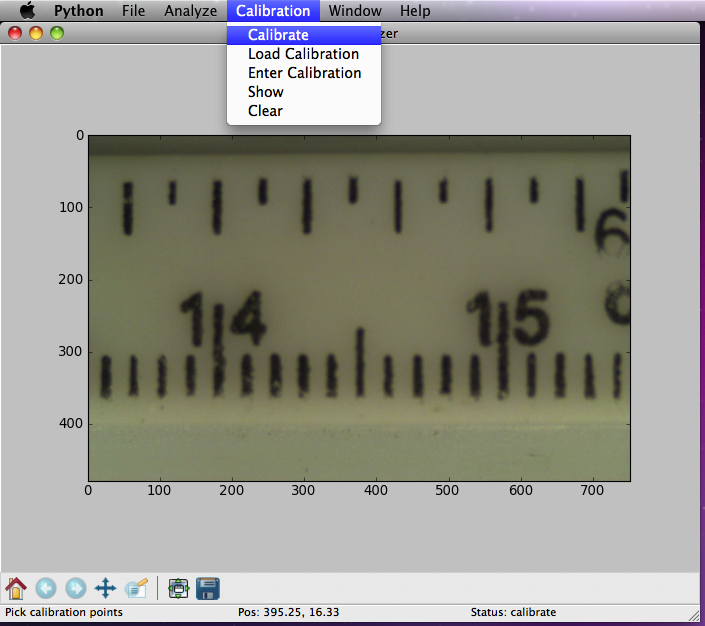
Fig. 14.3 Start calibration.
Note that as soon as you clicked Calibrate the status in the
lower right corner changes to calibrate. By clicking and holding
down the left mouse button you can enter the first and the second
calibration points. As soon as you release the button you are
presented with a dialog asking you for the type of calibration (Fig. 14.4).
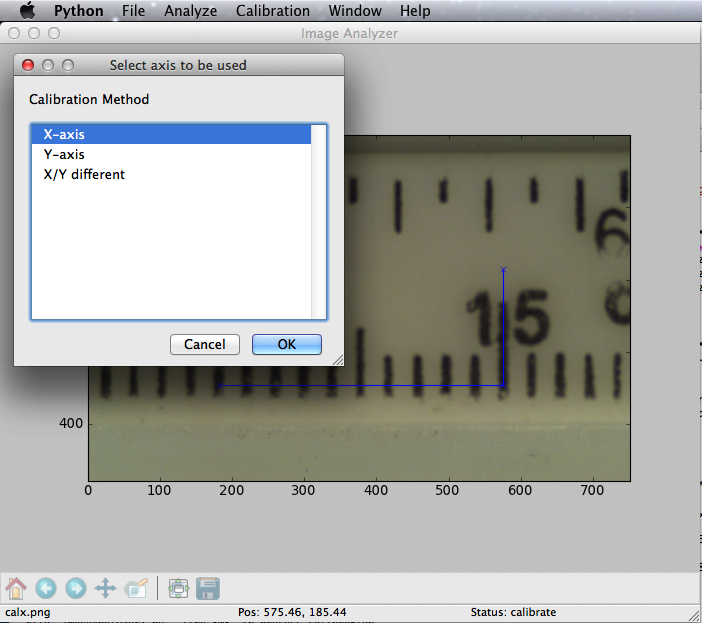
Fig. 14.4 Calibration type selection
You can either use the x-displacement (X-axis) or the y-displacement (Y-axis) to determine the common (for both axes) calibration factor, or you can select to enter independent calibration factors for both axes (X/Y independent). Once you have made your selection a dialog windows opens where you can enter the corresponding displacement in world (e.g. mm) units (Fig. 14.5).
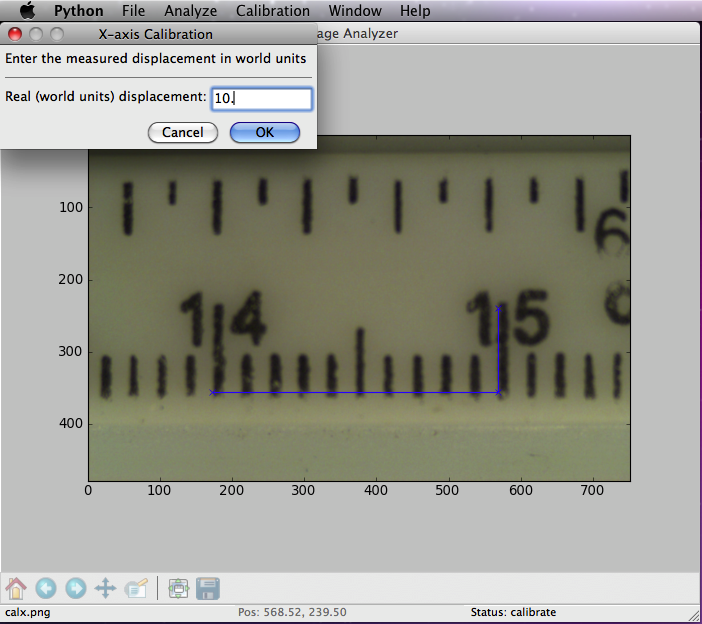
Fig. 14.5 Enter world data for selection.
Once the calibration is completed you see the 2 displacements labeled with the corresponding distances.
This is a good moment to save the calibration into a data file. From the menu select \(File \rightarrow Save As\) and enter the file name you want to use.
14.2.2. Performing Measurements in an Image
Once you have calibrated your image you can extract measurements between different points and have them drawn and labeled on the image. First open an image file (Fig. 14.6):
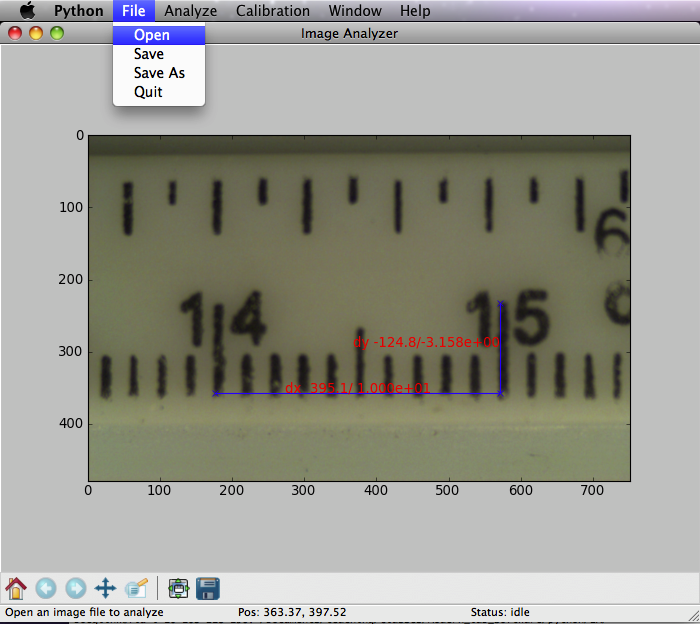
Fig. 14.6 Open image file for measurement.
This will open the new image but keep your last calibration constants. From the Analyze menue select Measure (Fig. 14.7):
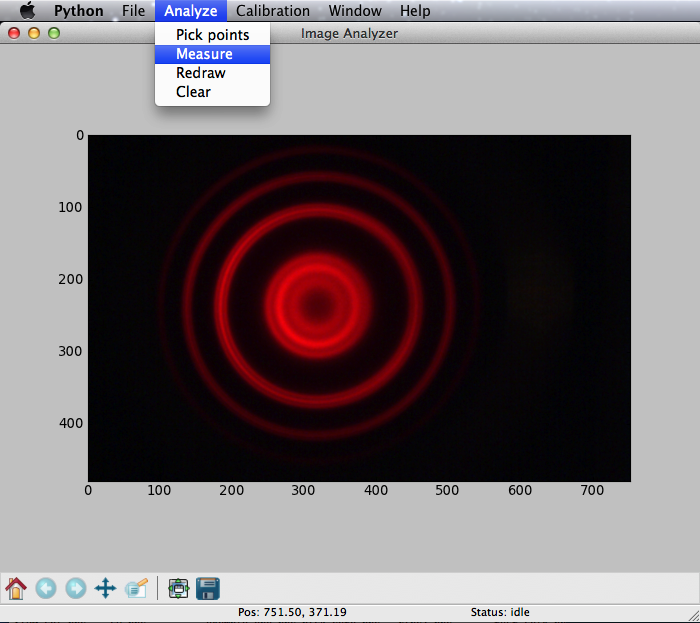
Fig. 14.7 Select analysis method: measure.
Then move the cursor to the fist point of your distance measurement and click and hold the left mouse button. Drag the cursor to the second location and release it. The measured distance will be drawn and labeled in pixel as well as user units (see Fig. 14.8)
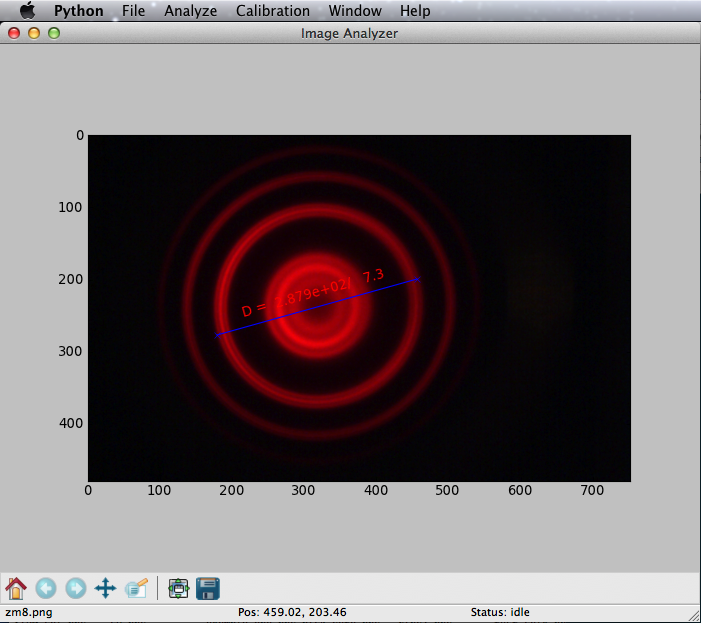
Fig. 14.8 Measured distance.
14.2.3. Picking Positions
You can also extract position information from the images you took. When you have to pick locations in the image it is often useful to zoom into that part. You can do this by clicking on the icon at the edge of the image (indicated by a yellow arrow in Fig. 14.9):
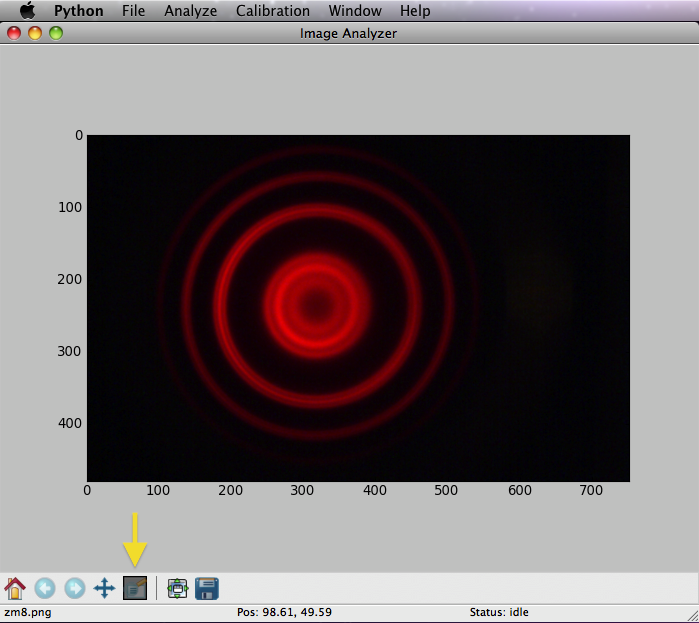
Fig. 14.9 Select zoom.
Click and drag the zoom-rectangle over the area you would like to enlarge (Fig. 14.10 (a)):
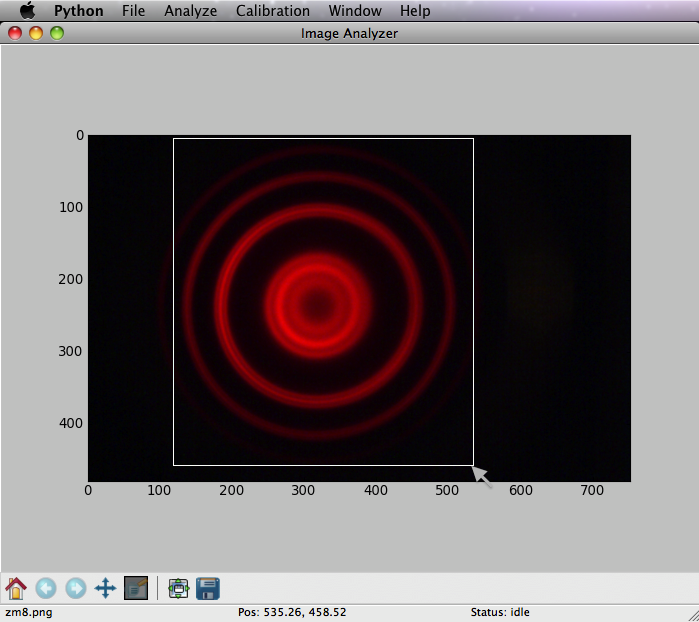
Fig. 14.10 Select area to be zoomed.
You will then see the selected portion of the image (Fig. 14.11). It is important that you turn off zooming by again clicking on the magnifying icon (yellow arrow in Fig. 14.11.
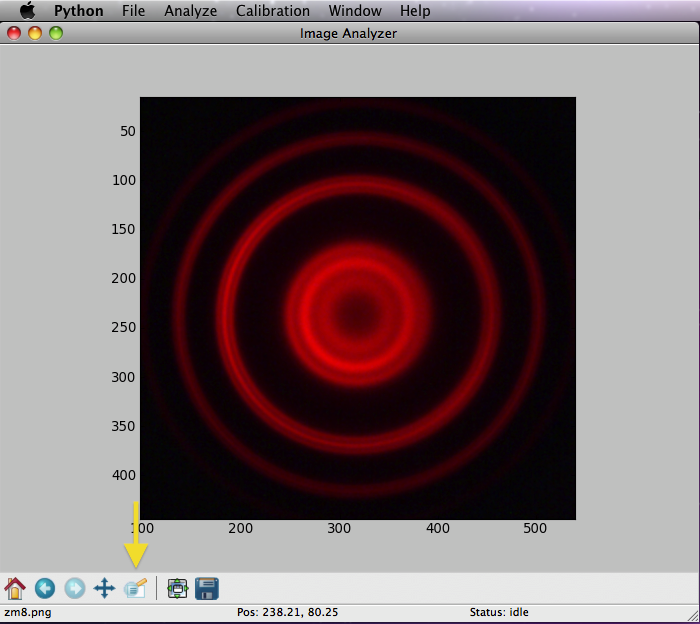
Fig. 14.11 De-select zoom.
To start picking points select \(Analyze \rightarrow Pick Points\) (Fig. 14.12)
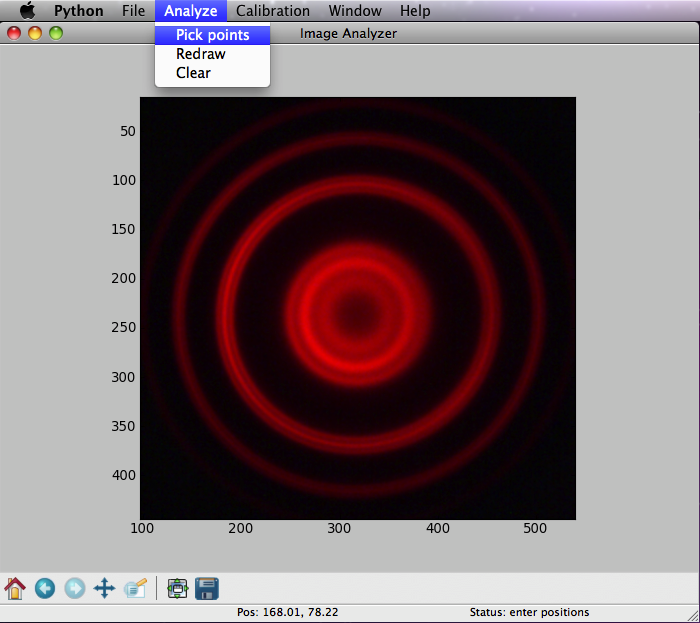
Fig. 14.12 Select to pick points.
To pick a point just left-click on the location. The program will store the position and draw a marker. While you are entering positions the status will show: enter positions (Fig. 14.13).
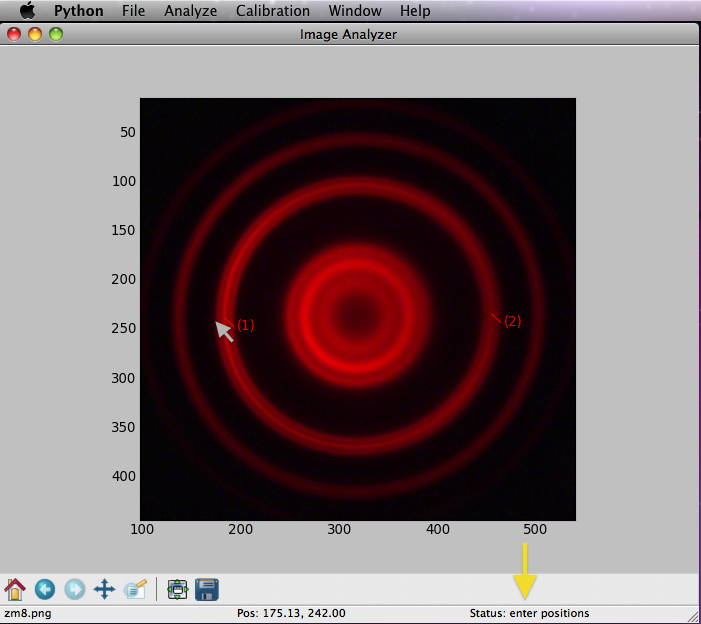
Fig. 14.13 Entering positions
Important terminate entering positions with a right-click. The status will go back to idle. Now you can save your positions by selecting :\(File \rightarrow Save\ As\) and enter the file name or pick an existing file to overwrite (Fig. 14.14).
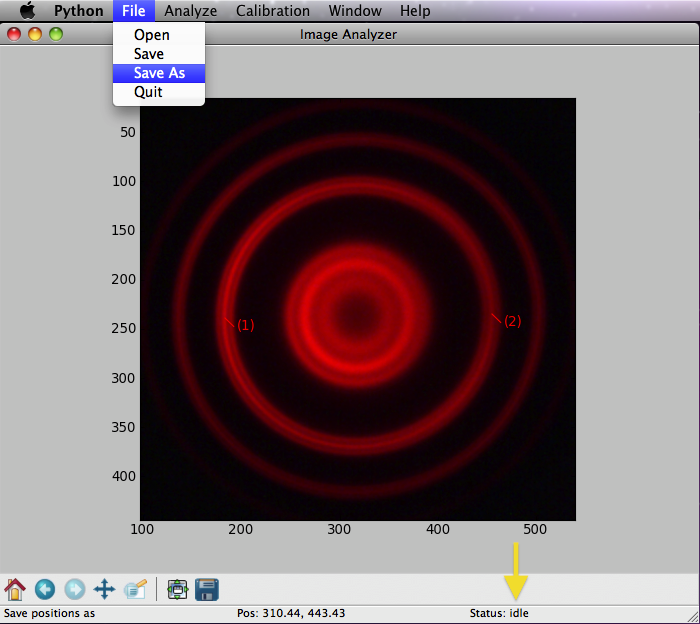
Fig. 14.14 After finishing entering positions, save the data
Your positions and your calibration factors are now saved in this file. You will also get another image file with the same name containing you marked positions. The data file can be read with the standard LT.box tools. The file contents typically looks as follows:
# data points from file : /Users/boeglinw/IA/Zeeman/zm8.png
# xpc and ypc are positions in calibrated user units (e.g mm)
#
# Calibration information
#\ convx_av =  2.5224e-02
#\ convy_av =  2.5224e-02
#! n[i,0]/ xp[f,1]/ yp[f,2]/ xpc[f,3]/ ypc[f,4]/
0  1.8375e+02  2.3969e+02  4.6348e+00  6.0460e+00
1  4.5658e+02  2.4180e+02  1.1517e+01  6.0992e+00
The meaning of each variable is as follows:
Name |
Meaning |
|---|---|
convx_av |
x-axis calibration factor (parameter) |
convy_av |
y-axis calibration factor (parameter) |
xp |
pixel x-coordinate |
yp |
pixel y-coordinate |
xpc |
x-coordinate in world units |
ypc |
y-coordinate in world units |
14.2.4. Loading a Calibration from an Existing Data File
You can load the calibration from a saved data file and use it for further image analysis, this occurs if you calibrated your image and analyzed a few images but had to close the program and now you would like to continue. In this case you load the calibration parameters from your saved data by doing \(Calibration \rightarrow Load\ Calibration\) and select your data file. Now you should be ready to open and image file and pick locations. You can always check your current calibration constants using \(Calibration \rightarrow Show\) which will show you the current parameters for the x-axis and y-axis. You can also enter them by hand.